
Transport can be seen to have three priorities: safety, financial sustainability, and performance. Safety is an unarguable aim, and one where risks must be reduced to be as low as reasonably practicable. Failures in safety management are obvious and notable, so whilst there certainly are different ways of understanding and managing the data available, that measurement is not necessarily a contentious subject. Finance is naturally regulated by accounting standards and practices that are set on a far wider scope than just the transport industry, and as such there can be little argument over how figures are derived, no matter what argument might be had over what should be done with them or what truly constitutes financial sustainability in an industry which receives significant public subsidy.
Performance therefore is distinct from both the other priorities. Performance measurement is necessarily internal and bespoke to the industry, with the metrics used for measurement defined by the industry itself with little comparison to other industries, or indeed across transport sectors, possible. In addition, some performance risks and impact is accepted because it would be completely impractical and undesirable to see delays to trains through the lens of “as low as reasonably practicable” (ALARP) and therefore a zero tolerance approach to performance is unhelpful. The industry therefore has to carefully select how it will communicate the performance of its product, knowing that 100% success rates cannot be expected or reported.
This is the first of two articles that will focus on the current status of performance measurements within rail and within Great Britain, concentrating on major train operating companies operating on Network Rail infrastructure, so not including London Underground and other metro operations. It should be apparent however, that other sectors within the transport industry will have similar issues, although their requirements for how performance is measured will vary alongside their differing operations. This first article will cover the basic aspects of performance measurement, the current metrics that are used and the issues that are presented, both in theory and practice.
A significant, but misunderstood, issue
Performance metrics and the means of measuring the seemingly simple question of whether trains run on-time is perhaps a hidden issue for transport. It certainly is a topic of some impact with some wider discussion, with the press running stories specifically on the subject of measurement of railway performance, including local press (Oxenholme and Penrith train stations among worst in UK) and some issues of national importance (Train passengers in Britain still facing record number of cancellations). Indeed, this can hardly be seen as a recent trend, as similar articles specifically questioning the measurement of performance (as opposed to simply the results) can be found dating from over 15 years ago (Network Rail’s claim of ‘record punctuality’ runs into criticism) and doubtless were not new then either. In all cases, these articles demonstrate the importance of performance to the public, but also the need for a common understanding of the issues causing performance decline alongside understanding of how those issues can be expressed. Indeed, some journalists, faced with an unfamiliar and somewhat complicated area on which to report have gotten unstuck, with difficulty in understanding what the industry is saying about its own performance resulting in some confused or incorrect messages.
There though is less discussion of how performance should be measured, which might be seen as technical and unimportant. This lack of open discussion results in the hidden nature of the issues, they are unfamiliar to many, even within the industry. There is perhaps a tendency, considering that the metrics are decided and the data produced by the industry itself, for measurement of performance to sometimes be seen as something that the industry produces to ‘cheat’ or produce good news stories. This perception exists even if in reality the metrics set are harsher or less suited to producing good news than they could be, as is often the case.
In addition to public publication and communication of performance outcomes, a role of measurement is to ensure that performance management and improvement has a common currency. For this to be effective it needs to be well understood, which is perhaps something that is lacking in some aspects across the industry. This is often due to a recent tendency for new metrics to be created without the time being taken to truly understand what they measure and how they truly are influenced by causes of delays and cancellations of trains.
There have also been some recent developments related to the measurement of rail performance, which certainly seems to be an unending drama and cause of discussion amid the background of industry reform. 2024 saw the Office of Rail and Road carry out a consultation on which performance metrics Network Rail should use, both from a regulatory perspective and to give a wider view of performance – this will be covered in detail in the second article in this series. Alongside, and supporting that consultation, Passenger Focus carried out research to gauge the public expectations, views on performance, and its measurement – we will discuss this and its findings. In 2025, the DfT required train operating companies to publish performance data poster for individual stations, announced to much fanfare without seemingly having further impact. Each of these developments has resulted in changes to total landscape of metrics used, sometimes with unintended consequences and often without the industry fully understanding the change itself, which presents problems when the metrics are used to set targets or in a regulatory environment.
Basic Definitions
Broadly, there are three components to what can be called train running performance. There are other aspects to performance, which will be discussed more fully in the second two articles within the series, but these are the aspects that can be determined from data that tracks and records a train’s progress through its journey.
- Delay: the time that trains lose in comparison to their schedule. Delay can only be assessed between two different planned events, eg by comparing the time that a train actually takes to get from point A to point B to the time that was scheduled, or the time that a train waits at a station compared to the booked dwell. Delay can be incurred anywhere along a train’s journey (or indeed, before the journey has even begun) and also can be recovered later on. To be understood in the correct context, delays need to be categorised according to their cause through a delay attribution process.
- Lateness: the minutes that a train completes an activity (passing a point, arriving or departing a station) after the scheduled time (so a train running perfectly on-time has zero lateness, and early trains have negative lateness). Lateness is an effect of delay, although not all delays will result in lateness at points beyond where it was incurred if the time can be recovered. Lateness is most often seen as relevant at station arrivals, as that is the lateness that passengers experience. Punctuality measures summarise lateness by expressing the number of trains that are within a lateness tolerance.
- Reliability: whether the train runson-time, late, or is cancelled. Cancellations can take multiple forms: a train may not run, might run part of its route and then fail to reach its destination, might only start its journey somewhere along the route, or might miss out stations due to diversion or in an attempt to recover lateness. All of these events affect the reliability of the service and therefore need to be considered within performance metrics, but they do not necessarily have equivalent passenger impact.
It should be noted that there are links between these different aspects of performance. Delay causes lateness, and lateness can cause unreliability if it requires the train to be cancelled to recover. In addition, as these aspects are separate, questions can immediately arise as to which should be seen as most important, with particular emphasis on the potential trade-off between late trains and cancellations. Performance metrics should attempt to provide the structure to answer that question, alongside understanding of passenger needs to ensure that they are incentivised correctly, but to be effective this requires clear understanding and a clear indication of the desired outcome.
Historically, the metric used by the Great British rail industry for the measurement of performance was public performance measure, PPM. This is simply the percentage of trains that arrive at their destination within 5 or 10 minutes (depending on the type of train, short distance trains getting 5 minutes of leeway, long distance trains 10) and having called at every planned stop along the route. For many years, this was almost universally used as the regulatory metric across the industry.
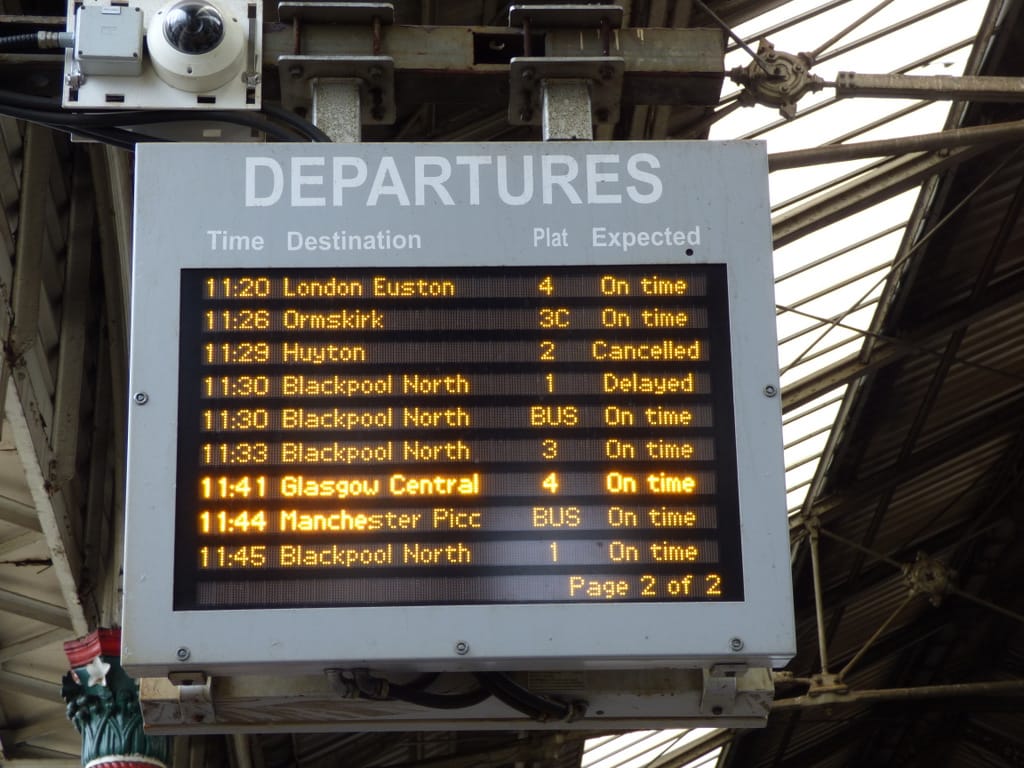
Since the start of Network Rail’s Control Period 6 in 2019, the infrastructure operator has been using on-time and cancellations as joint performance metrics. On time is a measure of lateness, and in contrast to PPM is based on the lateness of every station stop along every train’s journey (instead of just the termination point), the measure simply being the percentage that are early or less than 1 minute late. Cancellations measures the reliability of trains, with trains counting as fully cancelled if they run less than 50% of their planned mileage (including those that do not run at all), and part cancelled if they run over 50% of their planned route by distance, or if they run all of it but fail to call at one or more stations along the way. Full cancellations are weighted as 1, part cancellations as half, and the overall metric is the percentage of trains that are cancelled. Between them, these metrics attempt to show the overall level of performance success as experienced by the passenger.
On time can come in different ‘flavours’, by using a different lateness tolerance instead of counting a success as a train arriving at each station only if it arrives within 1 minute of the planned time. The most common metrics used are Time to 3 (T3), which counts a train as a success if it arrives less than 3 minutes late and T15, which allows 15 minutes of leeway. These have been used in train operating company (TOC) contracts following Covid and attempt to give a more rounded view of the amount of delay passengers experience.
In addition to these metrics, both Network Rail and operators have delay measures included within their contractual or regulatory performance regimes. These ensure that every party’s contribution to the total lateness of trains is recorded and recognise that one organisation’s good work can be undone by another’s poor performance, where even if the output is deemed acceptable this does require some attention.
PPM as a metric has been replaced across much of the industry (a few operators with contracts not specified by the DfT continue to use PPM or variants, including Merseyrail and Scotrail). But it broadly did provide a reasonable comparison for performance and correlated well with passenger’s overall experience of the service, including how often they complained about they complained about delays and how much of their fares they claimed back through delay repay. Therefore, the change to cancellations, on-time, and, T3 raises a number of issues in general, regardless of how those metrics are used.
Performance Metrics - Overall Issues
There is perhaps a case that, in moving away from PPM to the new metrics, the baby has been thrown out with the bathwater and that by trying to fix issues of PPM, some of the strengths have also been lost.
Performance metrics can be categorised as composite metrics if they attempt to measure multiple aspects of performance. This was the case with PPM, which is a composite metric as trains can fail PPM by either being cancelled or running late. The current metrics in contrast measure punctuality on a station level. This is seen as a major improvement as it removed the perception of the industry ‘cheating’ through ensuring punctuality of the train at destination, regardless of late running earlier on. The reliability measure continues to be on a train basis, so is not consistent with the punctuality metrics, which in turn erodes the principle of performance metrics creating a common currency for operational understanding. The current industry metrics distinguish between reliability and punctuality, with each metric only recording information about one aspect of performance, again affecting their ability to create a common currency, as it is unclear what level of lateness should be seen as equal to a cancellation.
The ORR have considered the issue of using composite metrics, stating that:
“There is no single train performance measure that provides a balance between the above components in a way that is transparent and simple to understand. Therefore, we continue to choose a selection of measures to provide a picture of overall performance, for the purpose of holding Network Rail to account. We have considered the use of a composite measure but decided that retaining separate elements fulfils our purpose, as well as being simpler for passengers and allowing frontline operational staff to understand how their actions can make a difference.”
This is a questionable point, because the separate elements also remove the possibility of having a single result indicative of overall performance (so can hardly be seen as simpler for passengers) and can also lead operational staff unclear on what the performance objective should be – whether preventing delay or cancellations is more valuable.
Metrics can also be categorised based on the basis on which they measure performance. Three common options are trains, station stops, and train miles, with current industry metrics measuring reliability on the basis of trains, punctuality on the basis of station stops and delay on the basis of train miles. PPM, in addition to being a composite measure, uses trains as the basis and as such treats every train service equally. This has obvious disadvantages in that not all trains carry equal passengers and that in many cases the time a train reaches its destination is of no relevance to the passenger experience, as many services see the vast majority of passengers alight before the terminus. As a result, the new metrics record each station stop equally, with the explanation that this measures whether passengers, not trains, reach their destination on-time. This explanation, of course, is only partially true, because station stops do not all see the same number of passengers alighting, so delays at a minor station are not equivalent to those at a major terminus. In addition, the train’s origin station is also included, which is questionable, considering that no passengers alight there at all.
There have been some attempts recently to amend the metrics to account for this, including Transport for Wales devising a measure that used T3, which they call On Time to 3 (OTT3), but weighted by putting stations into categories based on how busy they are. This has since been sidelined, largely because it didn’t give results that were significantly different from conventional measures, either in terms of painting a rosier picture or in providing additional insight to operators. It seems with this that trying to create a more intricate measure has limited value, the simpler measures generally correlate with passenger experience well and are better at creating the common industry currency for understanding of performance.
PPM also had the advantage of distinguishing between short and long-distance trains, with long distance trains being treated as seeing acceptable punctuality if they arrived less than 10 minutes late, compared to 5 minutes for short distance trains. This aligns with both operational realities and passenger expectations but has no equivalent in current industry metrics – all trains are assessed on the same tolerance of lateness, whether that is logical and realistic or not.
There is a strong case for different service types to be measured using metrics defined in different ways, going beyond simply using different time tolerances for lateness. One complaint sometimes heard from the performance team for the Elizabeth Line is that the industry cancellations metric is not relevant for how passengers use the line because they rarely are attempting to catch any particular train in the timetable. In truth, the approach of using cancellations and Time to 3 as the main performance metrics is most applicable to services with an hourly or half hourly interval, without too much of a mix of services and stopping patterns in the area. The majority of services, especially in London and the South East, fall into this broad category. But it falls apart when frequencies get much higher or on a mixed traffic railway. To counter this in part there is a metro performance metric within the nationally agreed definitions of performance metrics to demonstrate the waiting and journey time that the average passenger will face, based on arriving at their origin station at a random time. This measure, whilst potentially insightful, has not seen much use, partially because of the small areas of the network that it is relevant to and because of the difficulty of understanding it without a national basis for comparison. On the other hand, long distance operators don’t see the same level of punctuality, which is a relatively inevitable fact of railway operations that also aligns with passenger expectations – so why should all trains use the same performance metrics?
In many ways, the ideal measure would be one that is a composite metric calculated on the station level, where each station stop is considered a failure if the train arrives after a particular level of lateness or if the train is cancelled. This could then be further refined through weighting for passenger numbers or by adjusting the level of lateness tolerated based on the service type (or even the specific station, considering that better punctuality is expected closer to the start of a train’s journey and that punctuality at some stations is vital to maintain connections). However, this ideal measure is not achievable, because many stations rarely receive reports when a train runs but will be recorded every time a train is cancelled. This is especially true on rural branch lines, without automatic reporting of each train’s progress coming in from the signalling system, in these cases the reports are often based on manual reports from signallers or are based on GPS data – both of which are less reliable than the signalling system. This would be a problem for the hypothetical ideal station-level composite performance metric because at these stations almost all trains that are reported would be cancellations, and therefore would be counted as a failure, resulting in the metric giving a misleadingly pessimistic result. This issue can be overcome on a local level through signalling changes allowing automatic reports, but this is unlikely to reach all the network and furthermore cannot completely prevent manual or GPS reports because of remaining limitations in how the system operates. Therefore, for the time being at least a compromise has been taken where we can say separately but with certainty what proportion of trains ran and, of those that did and we have accurate reports of their running, how late they were.
Analytical Approach/Gaps in Industry Knowledge
One interesting point raised in the Transport Focus response to the ORR consultation (which will be analysed in full in the second article in this series) surrounded what they referred to as the ‘arrivals curve’, showing the total number of trains arriving at different levels of lateness. This was intended to demonstrate the importance of improving outcomes across the full range of lateness, rather than simply focussing on one threshold. An arrivals curve might look something like this:
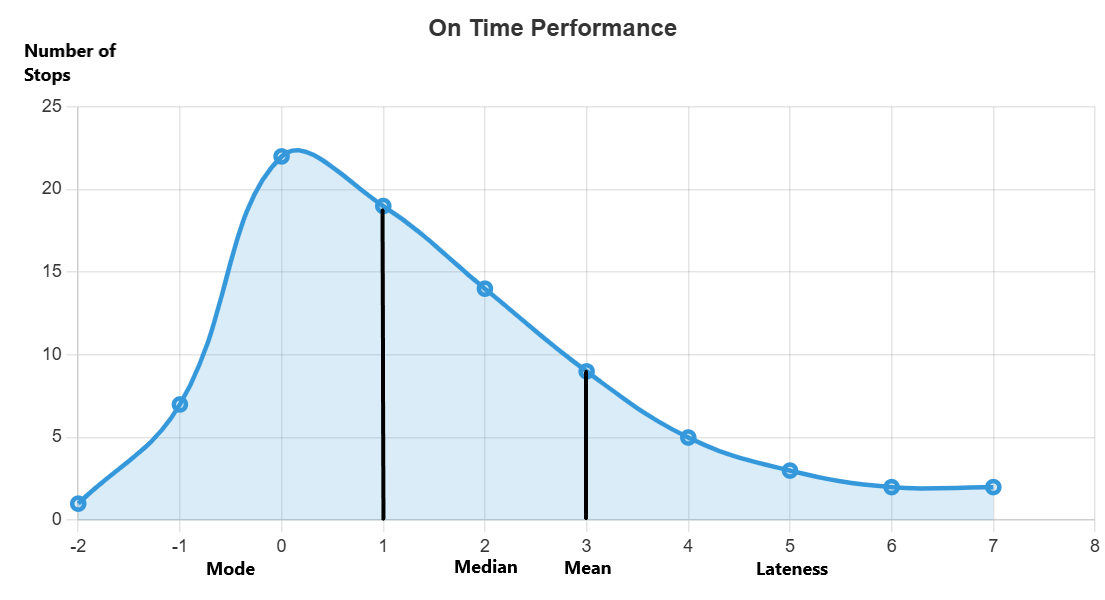
Within this, the area to the left of the line at 1 minute late represents the on-time trains, the area between the two lines are late but still T3 successes and the area on the right represents the T3 failures.
It is notable that the distribution is asymmetrical and single tailed, so as noted the modal delay is zero, the median delay might be around 1 minute, suggesting an on-time rate of only 50%, and the mean delay around 3 minutes. Clearly, no individual measure of performance will fully show the passenger outcomes delivered.
The shape of the graph is a function of both the network being described and the total level of delay. It can also be modified through management of services. None of these relationships are well understood through the industry. Some parts of the network will have strong resilience, so will not see many trains running a few minutes late but might still have a long tail with a few significantly delayed trains in the event of significant incidents causing poor performance.
It is also unclear on how increasing delay levels will alter the arrivals curve. Logically, increasing delay should lower the peak and move it, and the trains involved, to the right, decreasing the on time and T3 pass areas, and worsening punctuality metric outcomes. Clearly though, this will not be a simple or linear relationship and as yet it is one that is not yet well understood or exploited.
Performance metrics could create unusual incentives. It is possible to attempt to optimise the management of the network for particular metrics, therefore emphasising a particular level of lateness and ignoring or sacrificing trains that have already exceeded that level. For example, an operator incentivised to improve on-time and effective in its management to do so might see an arrivals curve like the following:
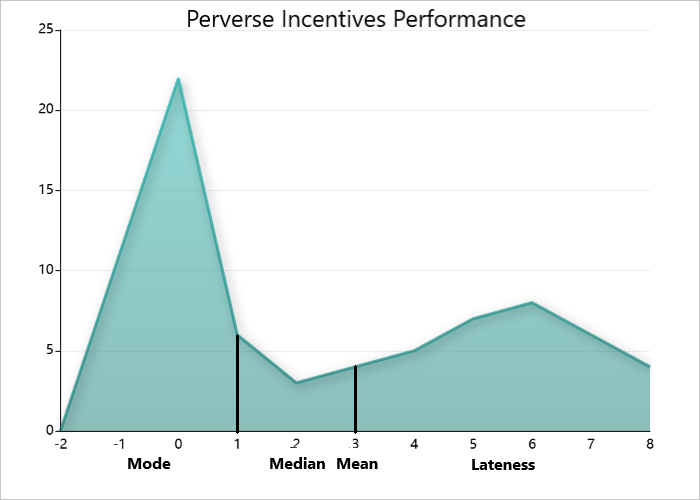
Clearly this would not be entirely optimal for passengers, as whilst it reduces their chance of being delayed at all, it results in more significant delays when their journey is disrupted. In reality, such changes are unlikely to be so stark, especially when considering the difference between on-time and T3, but it certainly is possible for performance to be aimed at inconsistent delivery in this way.
In truth, it is unclear if overall industry is optimised for any particular performance metric, with control over these matters being minimal. Certainly, understanding of these factors is in its infancy, not able to drive effective or deliberate management to any end. Therefore, this perhaps suggests an area for further understanding to be gained by the industry, alongside an indication of the risk of uncontrolled inconsistent performance.
Current Performance Levels
Currently the situation for performance is complicated and curious. The only notable feature is that performance is inconsistent. It is very notable that, compared to pre-Covid levels, there has been an improvement in both the on-time and T3 metrics, which does not correlate with tales of woe, including descriptions of the current performance as being in crisis and constantly described as sub-standard.
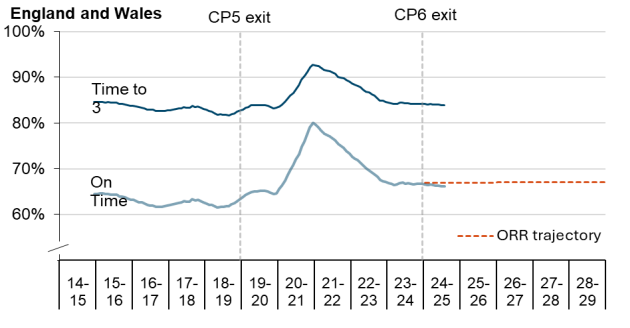
The truth is that other metrics have declined, including cancellations and T15. This shows the inconsistency of current performance – fewer journeys are disrupted than prior to Covid, but those that are disrupted are more likely to be cancelled or significantly delayed.
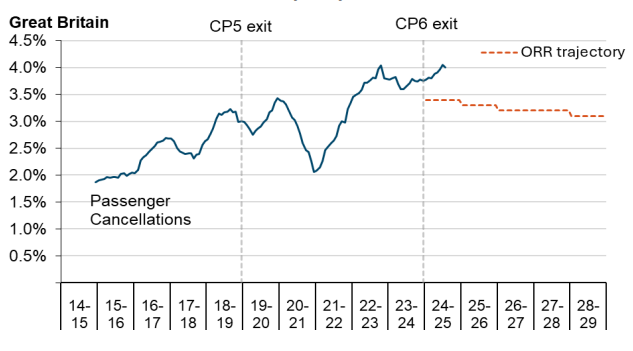
This is consistent with struggles for infrastructure and fleet reliability, major impacts of external events including trespass and problems of traincrew non-availability due to disrupted training, demographic changes within the traincrew communities and industrial action. For Time to 3 and on-time, this is offset by slightly reduced timetables, especially at peak times, allowing more resilience to small levels of delay. Unfortunately, it does not appear that these factors are well understood within the industry, with much discussion remaining focussed on the quality of timetables and minor delays, rather than the impacts that are causing cancellations and severely delayed trains.
Further Changes
In 2025, there was further development of the cancellation metric based on planned station stops rather than trains. This was suggested to be added as supporting measure for Network Rail, and subsequentially is being used in service agreements with TOCs, perhaps prior to data and understanding of the metric truly being ready. This idea seemed to originate within the project to introduce posters at stations showing performance, with the metric subsequentially being extended from an individual station to all planned stops. This could give a more total view of the impact of cancellations and also addresses the question of whether it is in principle acceptable to count a part cancelled train as only half cancelled - each stop is counted as fully cancelled if the train does not serve it. Despite its hasty introduction, it is unclear what benefit this metric provides. Station based cancellations correlate closely with the current cancellations results – the new metric doesn’t measure anything different. Instead, it seemingly exists to simply reduce the reported cancellation numbers by avoiding the ‘rounding up’ nature of the train based metric. This does mean that TOCs were forced to change their reliability measure changed so that it is no longer consistent with Network Rail, and indeed this has been recognised and the change is now in the process of being reversed. This reversal is perhaps positive news as the two metrics are highly correlated and measure similar aspects of performance, but could be a distraction, that presents the opportunity to be used as an excuse for inaction.
The next developments are somewhat unclear. Certainly, the current situation is somewhat confused with lots of different metrics, without the industry always understanding how they should be used. Equally, there are risks of trying to simplify the system, which could simply create additional competing standards. Another example of this is the different options for use as the industry measure of punctuality, which resulted in TOCs and Network Rail measuring their performance using different metrics. This resulted in the question being asked in 2024 of how Network Rail performance should be measured, a question that will be analysed in full in Part 2.
Overall, the important thing for the industry now could be seen as understanding the metrics we do have better, to understand how they are affected by different types of delay and the different incident causes that have different performance impact. This can be supported understanding of which performance improvement schemes will provide value for money, considering constrained funding situations. This can be supported by the research on different passengers and their preferences to ensure that services are assessed in the right way, and to avoid trying to treat metro operators in the same way as long-distance services, ensuring that the measurement of performance and accompanying improvement activity is aligned with passenger’s priorities.
Part 2 will be published shortly.